Note
Go to the end to download the full example code.
Working with projects#
This example provides an overview of the functionalities and the different types
of items that we can store in a skore Project.
Creating and loading the skore project#
We create and load the skore project from the current directory:
import skore

my_project = skore.Project("my_project")
There is a very simple and unique API for all objects:
my_project.put("my_key", "my_value")
There is no need to remember plt.savefig(...), df.to_csv(...),
np.save(...), etc for each type of object.
In the following, we will list all the different types of objects that we can
put() inside a skore Project.
Storing integers#
Now, let us store our first object using put(), for example an
integer:
my_project.put("my_int", 3)
Here, the name of the object is my_int and the integer value is 3.
We can read it from the project by using get():
my_project.get("my_int")
3
More generally, we follow the principile of “what you put is what you get”.
Like in a traditional Python dictionary, the put method will overwrite
past data if we use a key that already exists:
my_project.put("my_int", 30_000)
We can check the updated value:
my_project.get("my_int")
30000
See also
Actually, skore does not exactly overwrite, but stores the history of items. For more information about the tracking of items using their history, see Tracking items.
By using the delete() method, we can also delete an object:
my_project.put("my_int_2", 10)
my_project.delete("my_int_2")
We can display all the keys in our project:
['my_int']
Storing strings and texts#
We just stored a integer, now let us store some text using strings!
my_project.put("my_string", "Hello world!")
my_project.get("my_string")
'Hello world!'
get() infers the type of the inserted object by default. For
example, strings are assumed to be in Markdown format. Hence, we can customize the
display of our text:
my_project.put(
    "my_string_2",
    (
        """Hello world!, **bold**, *italic*, `code`

```python
def my_func(x):
    return x+2
```
"""
    ),
)
Moreover, we can also explicitly tell skore the way we want to display an object, for example in HTML:
my_project.put(
    "my_string_3",
    "<p><h1>Title</h1> <b>bold</b>, <i>italic</i>, etc.</p>",
    display_as="HTML",
)
Note that the display_as is only used for the UI, and not in this notebook at hand:
my_project.get("my_string_3")
'<p><h1>Title</h1> <b>bold</b>, <i>italic</i>, etc.</p>'
We can also conveniently use a Python f-string:
x = 2
y = [1, 2, 3, 4]
my_project.put("my_string_4", f"The value of `x` is {x} and the value of `y` is {y}.")
Storing many kinds of data#
Python list:
my_list = [1, 2, 3, 4]
my_project.put("my_list", my_list)
my_list
[1, 2, 3, 4]
Python dictionary:
my_dict = {
    "company": "probabl",
    "year": 2023,
}
my_project.put("my_dict", my_dict)
my_dict
{'company': 'probabl', 'year': 2023}
Numpy array:
import numpy as np

my_arr = np.random.randn(3, 3)
my_project.put("my_arr", my_arr)
my_arr
array([[-0.86330973,  1.35312969, -0.19322573],
       [ 0.48155874,  0.5343325 ,  1.42763297],
       [-0.39758877,  1.33064685,  0.32829924]])
Pandas data frame:
import pandas as pd

my_df_pandas = pd.DataFrame(np.random.randn(10, 5))
my_project.put("my_df_pandas", my_df_pandas)
my_df_pandas.head()
Polars data frame:
import polars as pl

my_df_polars = pl.DataFrame(np.random.randn(10, 5))
my_project.put("my_df_polars", my_df_polars)
my_df_polars.head()
Skrub TableReport:
from skrub.datasets import fetch_employee_salaries
from skrub import TableReport

dataset = fetch_employee_salaries()
employees_df, salaries = dataset.X, dataset.y
my_tablereport = TableReport(employees_df)
my_project.put("my_tablereport", my_tablereport)
my_tablereport
Processing column   1 / 8
Processing column   2 / 8
Processing column   3 / 8
Processing column   4 / 8
Processing column   5 / 8
Processing column   6 / 8
Processing column   7 / 8
Processing column   8 / 8
Storing data visualizations#
Note that, in the dashboard, the interactivity of plots is supported, for example for Altair and Plotly.
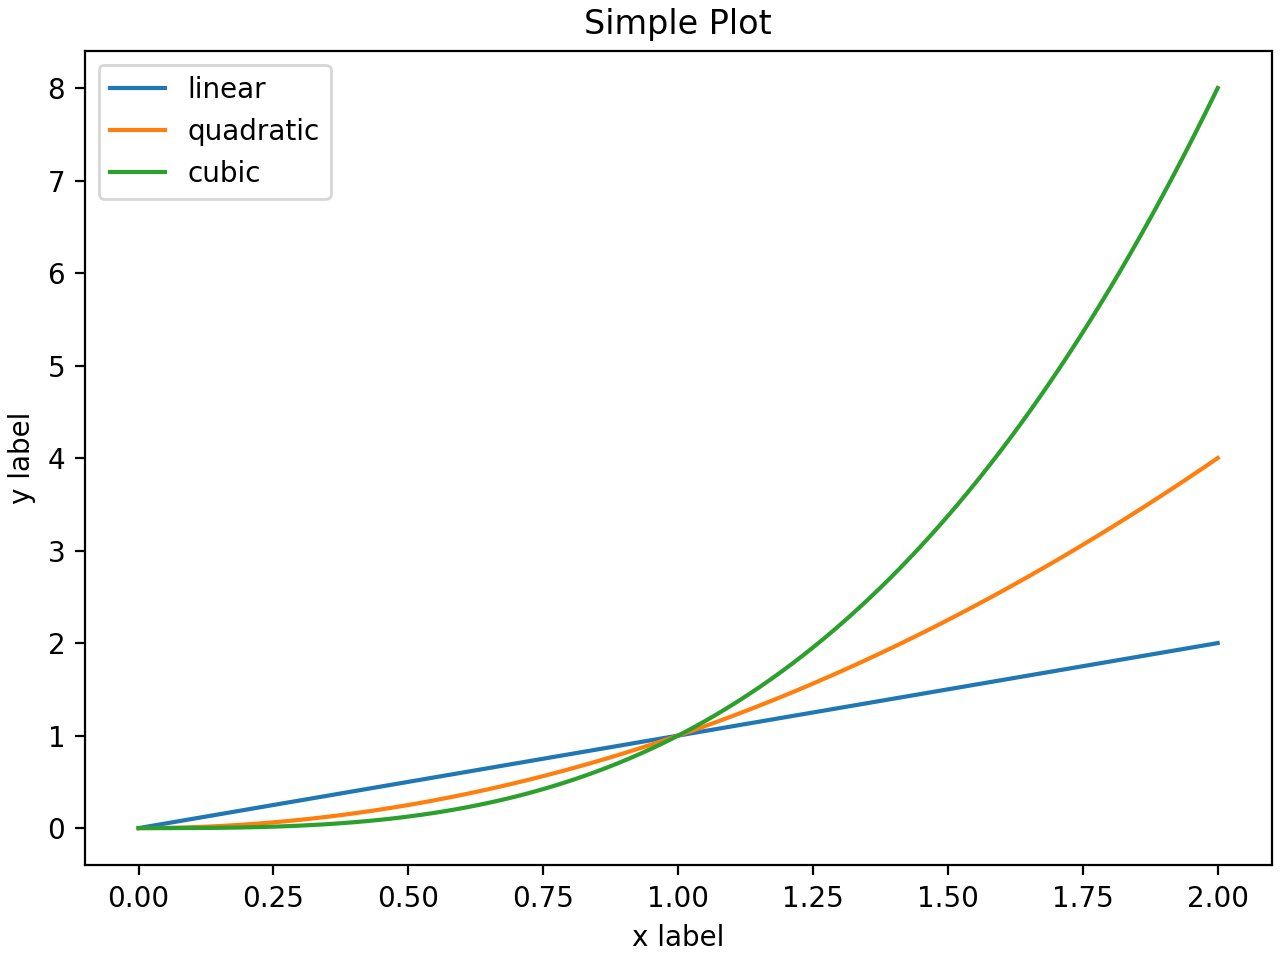
Matplotlib figure:
import matplotlib.pyplot as plt

x = np.linspace(0, 2, 100)

fig, ax = plt.subplots(layout="constrained")
ax.plot(x, x, label="linear")
ax.plot(x, x**2, label="quadratic")
ax.plot(x, x**3, label="cubic")
ax.set_xlabel("x label")
ax.set_ylabel("y label")
ax.set_title("Simple Plot")
ax.legend()
plt.show()

my_project.put("my_figure", fig)
Altair chart:
import altair as alt

alt.renderers.enable("default")

num_points = 100
df_plot = pd.DataFrame(
    {"x": np.random.randn(num_points), "y": np.random.randn(num_points)}
)

my_altair_chart = (
    alt.Chart(df_plot)
    .mark_circle()
    .encode(x="x", y="y", tooltip=["x", "y"])
    .interactive()
    .properties(title="My title")
)

my_project.put("my_altair_chart", my_altair_chart)
Note
For Plotly figures, some users reported the following error when running Plotly
cells: ValueError: Mime type rendering requires nbformat>=4.2.0 but it is not
installed. This is a Plotly issue which is documented here; to solve it, we recommend
installing nbformat in your environment, e.g. with:
pip install --upgrade nbformat
Plotly figure:
import plotly.express as px

df = px.data.iris()
fig = px.scatter(
    df, x=df.sepal_length, y=df.sepal_width, color=df.species, size=df.petal_length
)

my_project.put("my_plotly_fig", fig)

fig
Animated Plotly figure:
df = px.data.gapminder()
my_anim_plotly_fig = px.scatter(
    df,
    x="gdpPercap",
    y="lifeExp",
    animation_frame="year",
    animation_group="country",
    size="pop",
    color="continent",
    hover_name="country",
    log_x=True,
    size_max=55,
    range_x=[100, 100_000],
    range_y=[25, 90],
)

my_project.put("my_anim_plotly_fig", my_anim_plotly_fig)

my_anim_plotly_fig
Storing scikit-learn models and pipelines#
First of all, we can store a scikit-learn model:
We can also store scikit-learn pipelines:
from sklearn.pipeline import Pipeline
from sklearn.preprocessing import StandardScaler

my_pipeline = Pipeline(
    [("standard_scaler", StandardScaler()), ("lasso", Lasso(alpha=2))]
)
my_project.put("my_pipeline", my_pipeline)
my_pipeline
Moreover, we can store fitted scikit-learn pipelines:
from sklearn.datasets import load_diabetes

diabetes = load_diabetes()
X = diabetes.data[:150]
y = diabetes.target[:150]
my_pipeline.fit(X, y)

my_project.put("my_fitted_pipeline", my_pipeline)
my_pipeline
Storing skore objects#
See also
We can also store skore objects such as skore.EstimatorReport and
skore.CrossValidationReport.
See Simplified experiment reporting.
Total running time of the script: (0 minutes 4.520 seconds)